Quick Class Diagram

Share on:

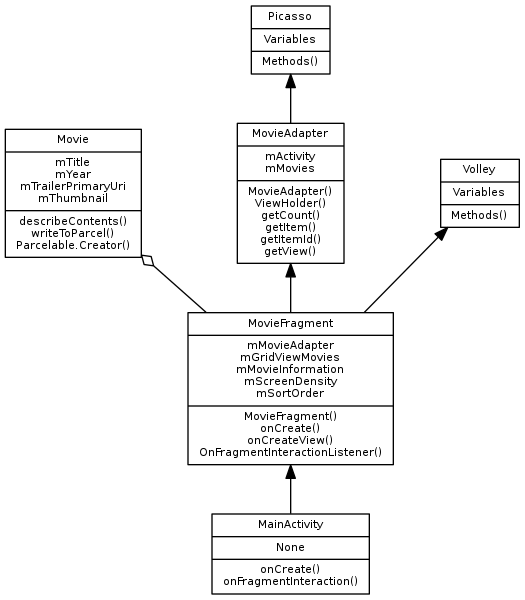
As someone who likes to write computer programs (and as a visual person), I do like to have a nice diagram accompany my programs, as per the example below:

:inline

The above output is produced by a tool called Quick Class Diagram. For the longest time, I have looked for an accessible method to create simple class diagrams. After trying a number of solutions most of which I felt were overkill, I came across this tool on the Google Code archive. To experiment, I initially decided to use it on the code I produced as part of documenting the Udacity Android Developer Nanodegree tutorial projects.

For background, Quick class diagram is a Python script that takes a text input file and generates a diagram (either SVG or PNG based) that is comprised of the relational information entered by the user. This process allows separation from the code generation task (i.e. it can be done independently) which is ideal for me. I wanted something to assist in the documentation process, and this is typically a process where I like to reflect in between multiple iterations of development.

The tool is not a recent application and the only source version I could find was via Google Code, a system long since deprecated. Given the vintage of the code presented, there are some small set-up points that need to be factored in. Firstly, I do not think this application is being updated anymore(?) as I could not find a more up to date link. I tried emailing the author but did not get a response. Fortunately, the application is written in Python, so it should be relatively straightforward to resolve any platform specific issues.

As mentioned the quick class diagram is written in Python and incorporates the GraphViz library to produce simple diagrams. In order to get the program running on your machine (I am making the assumption you are on Linux - i.e. Ubuntu 16.04 LTS - 64bit and have at least Python version 2.7), there are a couple of setup files to download and then run. If you are running a different operating system, you will need to ensure the dependencies are available and should be able to use this blog entry as a guide.

Graphviz

Graphviz is a dependency for the use of the diagramming tool and needs to be available on your system. For an Ubuntu based computer system, the following commands will add this resource to your machine. Prior to installing the tool, please make sure your system is updated first (i.e. run sudo apt-get update prior to installing graphviz).

1sudo apt-get update
2sudo apt-get install graphviz

Once the Graphviz application is loaded onto your system, the next step is to add the code dependencies so the tool can be run on your machine.

Code dependencies

Note: the required code can (currently) be downloaded from the following locations:

https://code.google.com/archive/p/quickdiagrams/

https://code.google.com/archive/p/yapgvb/

Note for the quick diagrams application, I have placed an anglicised version on my GitHub. The original version has Spanish comments and text, but apart from that, is essentially the same.

You will need to download the tarball from each location on code.google.com and extract onto your machine. Within the extracted directories there will be a set-up file that needs to be run in a particular order, so let's take each application in turn.

YAPGVB

Firstly using the extracted yapgvb code we will need to edit the relevant operating system configuration file. On Linux (Ubuntu) this would be the config_linux2.py code. For our simple purposes, we will remove a dependency on the external C++ Boost library by changing the use_boost command line to False. So open the configuration file and make the following change to amend the true flag to indicate false.

File: yapgvb/config_linux2.py

use_boost = False

Save the amended config_linux2.py file and then execute the python installation script setup.py using the following command format i.e.

python setup.py install

This process should complete without any errors and provide your system with the library reference for yapgvb – without needing to install the Boost library.

Quick diagrams

Now we have the dependencies on our system we can now move into the quick diagrams directory, all we should now need to do now is to issue the set-up command. Again, if we look in the tool directory for quickclassdiagram, there should be a setup.py configuration file available. Execute the following installation command to enable the quickclassdigram application.

python setup.py install

At this point, you should note that if you make any changes to the code base of this application, you will need to repeat the above setup.py command to refresh the amended code base.

How to use

With the program now installed on your system, you should be in a position to test the tool using the example configuration files available in the examples directory. Navigate into the Quick diagrams examples directory and try and run the application from the command line against the following examples e.g.

quickclassdiagram -i foro_de_mesajes.sc

quickclassdiagram -help

If everything worked, you should see a message indicating that an output file has been generated. The signaling of a successful message from the running of the command line indicates that a diagram has been generated in the same directory. To view the image generated, simply use a graphics program to view the output.

The obvious next step would be to write your own configuration files which were remarkably simple. The foro_de_mesajes.sc (forum messages) file provides a good base example of what can be achieved by the tool. The configuration files provide an overview of the class and the relationships between the class members.

Example - Let's examine the forum messages configuration file.

 11     # User class
 22     User
 33     
 44     # User members
 55      nick
 66      numberCompleted
 77      email
 88      permission
 99     
1010    # User methods
1111     recordPassword()
1212    
1313    Forum
1414    # Forum members4546384823500609
1515     number
1616    
1717    # Forum methods
1818     ForumPrivate
1919     accessPermission
2020
2121    Message
2222    # Message members
2323     title
2424    
2525    # Relationships
2626    1 User * messages
2727    1 forum has many messages

Each class defined in the above statements is structured to represent the class its members and the associated methods. The file contents are laid out quite logically and follow the format you might use should you choose to define your own class structure. When the tool is run it will pick up these values leading to the creation of a simple class diagram illustrating the relative parts defined. To extend this, the program also allows relationships to be highlighted as in, 1 to 1 or 1 to many for example. The easiest way to achieve this is to use the arrow notation (i.e. →, ←) that simply reflects the nature of the relationship between the various objects in a nature object notation.

To use this notation you can, for example, do the following:

11    # Relationships
22    User -> messages
33    forum -> messages
44    User -> Telephone
55    Telephone <- User

To create a configuration file from scratch, there are a couple of things to take into consideration. The file is sensitive to tabs, so ensure any file created reflects the structure observed in the template examples. If the output generated does not reflect the intended relationship, just remember, you can regenerate the files as necessary.

If the relationships between objects change over time, the flexibility of the tool provides a quick and easy method to get a diagram. In generating the overview of the class interactions, this can provide a massive benefit to any developer wanting a quick visual medium for their program in order to explain the structure or relational interaction between objects.